Market Outlook
March 28, 2017
Market Cues
Domestic Indices
Chg (%)
(Pts)
(Close)
Indian markets are likely to open with positive bias tracking the SGX Nifty & Asian
BSE Sensex
(0.6)
(184)
29,237
markets.
Nifty
(0.7)
(63)
9,045
After initially coming under pressure, US market showed a lack of direction during
Mid Cap
(0.3)
(37)
13,812
trading on Monday. The major averaged spent the day bouncing back and forth
Small Cap
(0.0)
(6)
14,071
across the unchanged line. The initial drop by stocks came amid weakness overseas
Bankex
(0.1)
(36)
24,025
following the decision by Republican leaders to withdraw their bill to repeal and
replace Obamacare.
Global Indices
Chg (%)
(Pts)
(Close)
The European markets weakened Monday, as investors had their first opportunity to
react to the failure of a Republican bill to repeal and replace Obamacare. House
Dow Jones
(0.2)
(46)
20,551
Republican leaders decided to withdraw the bill amid indications of a lack of support
Nasdaq
0.2
12
5,840
late last Friday. The inability to advance the bill has cast doubt on U.S. President
FTSE
(0.6)
(43)
7,294
Trump's ability to deliver on promises of increased infrastructure spending, tax cuts
Nikkei
(1.4)
(277)
18,986
and deregulation.
Hang Seng
(0.7)
(165)
24,194
Indian markets fell notably on Monday after the Trump administration failed to pass
Shanghai Com
(0.1)
(2)
3,267
its healthcare bill and private weather forecaster Skymet predicted a below normal
rainfall for the June to September south-west monsoon season.
Advances / Declines
BSE
NSE
News Analysis
Advances
1,147
683
Dr Reddy’s inks distribution pact with Integra Life Sciences
Declines
1,672
1,001
Detailed analysis on Pg2
Unchanged
234
64
Investor’s Ready Reckoner
Volumes (` Cr)
Key Domestic & Global Indicators
BSE
8,810
Stock Watch: Latest investment recommendations on 150+ stocks
Refer Pg5 onwards
NSE
22,615
Top Picks
Net Inflows (` Cr)
Net
Mtd
Ytd
CMP
Target
Upside
Company
Sector
Rating
(`)
(`)
(%)
FII
584
21,818
32,256
Amara Raja Batteries Auto & Auto Ancillary
Buy
861
1,009
17.2
MFs
(175)
(1,708)
5,363
HCL Tech
IT
Buy
856
1,000
16.9
Power Grid Corp.
Power
Accumulate
195
223
14.1
Top Gainers
Price (`)
Chg (%)
Navkar Corp.
Others
Buy
174
265
52.4
KEI Industries
Others
Buy
176
207
17.9
Fincables
494
6.0
More Top Picks on Pg3
Sintex
105
4.9
Pnb
147
3.9
Key Upcoming Events
Previous
Consensus
Gvkpil
6
3.3
Date
Region
Event Description
Reading
Expectations
Petronet
408
2.9
Mar 28, 2017 US
Consumer Confidence
114.80
114.00
Mar 30, 2017 US
Initial Jobless claims
261.00
247.00
Top Losers
Price (`)
Chg (%)
Mar 30, 2017 US
GDP Qoq (Annualised)
1.90
2.00
Mar 30, 2017 Euro Zone Euro-Zone Consumer Confidence
-5.00
-5.00
Kec
194
(7.0)
Mar 31, 2017 Germany PMI Manufacturing
58.30
--
Nlcindia
105
(4.1)
Mar 31, 2017 Germany Unemployment change (000's)
-15.00
-10.00
Jswsteel
180
(3.8)
More Events on Pg4
Welcorp
83
(3.7)
Idea
88
(3.5)
As on March 27, 2017
Market Outlook
March 28, 2017
News Analysis
Dr Reddy’s inks distribution pact with Integra Life Sciences
Dr Reddy's Laboratories Ltd and Integra LifeSciences Holdings Corporation, a
global medical Technology company, have entered into an exclusive distribution
agreement. Under the agreement, will market and distribute DuraGen Plus and
Suturable DuraGen Dural Regeneration Matrices for use in patients in India. With
the launch of DuraGen, the company is looking forward to building its presence in
the segment of regenerative technologies and making a difference to the lives of
patients undergoing neurosurgery. Integra's DuraGen products have been
implanted in more than 1.8mn patients worldwide to effect dural closure following
neurosurgical procedures. Integra manufactures the DuraGen family of products
based on its proprietary Ultra Pure Collagen technology platform. The pact will
further strengthen the domestic offerings of dr Reddy’s Lab in India. We maintain
our Neutral view on the stock.
Economic and Political News
BPL homes to get free power connections in UP
Road construction at 6,604 km, misses target of 15,000 km for FY17
Govt okays 101 cold chain projects costing `3,100Cr
GST draft bills tabled in Parliament; peg peak rate at 40%
Corporate News
Indian firms gaming H1B visa system: US lawmaker
Lupin expects muted growth in the US despite new launches
BHEL commissions 250 MW eco-friendly power plant in Gujarat
L&T bags `705Cr order for water transmission project in Tanzania
L&T Construction wins orders worth `2490Cr
Market Outlook
March 28, 2017
Top Picks ★★★★★
Large Cap
Market Cap
CMP
Target
Upside
Company
Rationale
(` Cr)
(`)
(`)
(%)
To outpace battery industry growth due to better technological
Amara Raja Batteries
14,704
861
1,009
17.2
products leading to market share gains in both the
automotive OEM and replacement segments.
Strong growth in domestic business due to its leadership in
Alkem Laboratories
26,351
2,211
2,257
2.1
acute therapeutic segment. Alkem expects to launch more
products in USA, which bodes for its international business.
The stock is trading at attractive valuations and is factoring all
HCL Tech
1,20,758
856
1,000
16.9
the bad news.
Back on the growth trend, expect a long term growth of 14%
Infosys
2,36,310
1,029
1,249
21.4
to be a US$20bn in FY2020.
Strong order backlog and improvement in execution would
Larsen & Tourbo
1,44,297
1,547
1,700
9.9
trigger the growth for the L&T.
One of the largest pharma companies with strong
Lupin
66,063
1,463
1,809
23.6
international presence. It has a rich pipeline of ANDAs which
is also one of the largest among the generic companies.
Going forward, we expect the company to report strong top-
Power Grid Corporation
1,02,225
195
223
14.1
line CAGR of ~16% and bottom-line CAGR of ~19% over
FY16-18 on back of strong capitalization guidance
Source: Company, AngelResearch
Mid Cap
Market Cap
CMP
Target
Upside
Company
Rationale
(` Cr)
(`)
(`)
(%)
We expect the company would report strong profitability
Asian Granito
1,059
352
380
8.0
owing to better product mix, higher B2C sales and
amalgamation synergy.
Among the top 4 players in the consumer durables segment.
Bajaj Electricals
3,165
313
330
5.5
Improved profitability backed by turn around in E&P segment.
Strong order book lends earnings visibility.
Favourable outlook for the AC industry to augur well for
Cooling products business which is out pacing the market
Blue Star
5,919
619
660
6.6
growth. EMPPAC division's profitability to improve once
operating environment turns around.
Strong loan growth backed by diversified loan portfolio and
Equitas Holdings
5,370
159
235
47.8
adequate CAR. ROE & ROA likely to remain decent as risk of
dilution remains low. Attractive valuations considering growth.
Economic recovery to have favourable impact on advertising
& circulation revenue growth. Further, the acquisition of a
Jagran Prakashan
5,788
177
225
27.1
radio business (Radio City) would also boost the company's
revenue growth.
High order book execution in EPC segment, rising B2C sales
KEI Industries
1,365
176
207
17.9
and higher exports to boost the revenues and profitability
Speedier execution and speedier sales, strong revenue visibilty
Mahindra Lifespace
1,695
413
522
26.4
in short-to-long run, attractive valuations
Higher growth in domestic branded sales and healthy export
Mirza International
1,032
86
107
24.7
to boost the profitability.
Massive capacity expansion along with rail advantage at ICD
Navkar Corporation
2,480
174
265
52.4
as well CFS augurs well for the company
Strong brands and distribution network would boost growth
Siyaram Silk Mills
1,598
1,705
1,872
9.8
going ahead. Stock currently trades at an inexpensive
valuation.
Market leadership in Hindi news genre and no. 2 viewership
ranking in English news genre, exit from the radio business,
TV Today Network
1,586
266
344
29.4
and anticipated growth in ad spends by corporates to benefit
the stock.
Source: Company, Angel Research
Market Outlook
March 28, 2017
Key Upcoming Events
Global economic events release calendar
Date
Time
Country
Event Description
Unit
Period
Bloomberg Data
Last Reported Estimated
Mar 28, 2017 7:30PM
US
Consumer Confidence
S.A./ 1985=100
Mar
114.80
114.00
Mar 30, 2017 6:00PM
US
Initial Jobless claims
Thousands
Mar 25
261.00
247.00
6:00PM
US
GDP Qoq (Annualised)
% Change
4Q T
1.90
2.00
2:30PM
Euro Zone
Euro-Zone Consumer Confidence
Value
Mar F
(5.00)
(5.00)
Mar 31, 2017 1:25PM
Germany
Unemployment change (000's)
Thousands
Mar
(15.00)
(10.00)
1:25PM
Germany
PMI Manufacturing
Value
Mar F
58.30
--
6:30AM
China
PMI Manufacturing
Value
Mar
51.60
51.70
Apr 3, 2017
2:00PM
UK
GDP (YoY)
% Change
4Q F
2.00
2.00
2:00PM
UK
PMI Manufacturing
Value
Mar
54.60
--
Apr 5, 2017
1:25PM
Germany
PMI Services
Value
Mar F
55.60
--
Apr 6, 2017
2:30PM
India
RBI Reverse Repo rate
%
Apr 6
5.75
--
2:30PM
India
RBI Repo rate
%
Apr 6
6.25
--
2:30PM
India
RBI Cash Reserve ratio
%
Apr 6
4.00
--
Apr 7, 2017
2:00PM
UK
Industrial Production (YoY)
% Change
Feb
3.20
--
6:00PM
US
Change in Nonfarm payrolls
Thousands
Mar
235.00
150.00
6:00PM
US
Unnemployment rate
%
Mar
4.70
4.70
Apr 10, 2017
India
Imports YoY%
% Change
Mar
21.76
--
2:00PM
UK
CPI (YoY)
% Change
Mar
2.30
--
Apr 11, 2017
India
Exports YoY%
% Change
Mar
17.48
--
Apr 12, 2017
2:00PM
UK
Jobless claims change
% Change
Mar
(11.30)
--
5:30PM
India
Industrial Production YoY
% Change
Feb
2.70
--
7:00AM
China
Consumer Price Index (YoY)
% Change
Mar
0.80
--
Apr 13, 2017
US
Producer Price Index (mom)
% Change
Mar
0.10
--
China
Exports YoY%
% Change
Mar
(1.30)
--
Apr 14, 2017
6:00PM
US
Consumer price index (mom)
% Change
Mar
0.10
--
Source: Bloomberg, Angel Research
Market Outlook
March 28, 2017
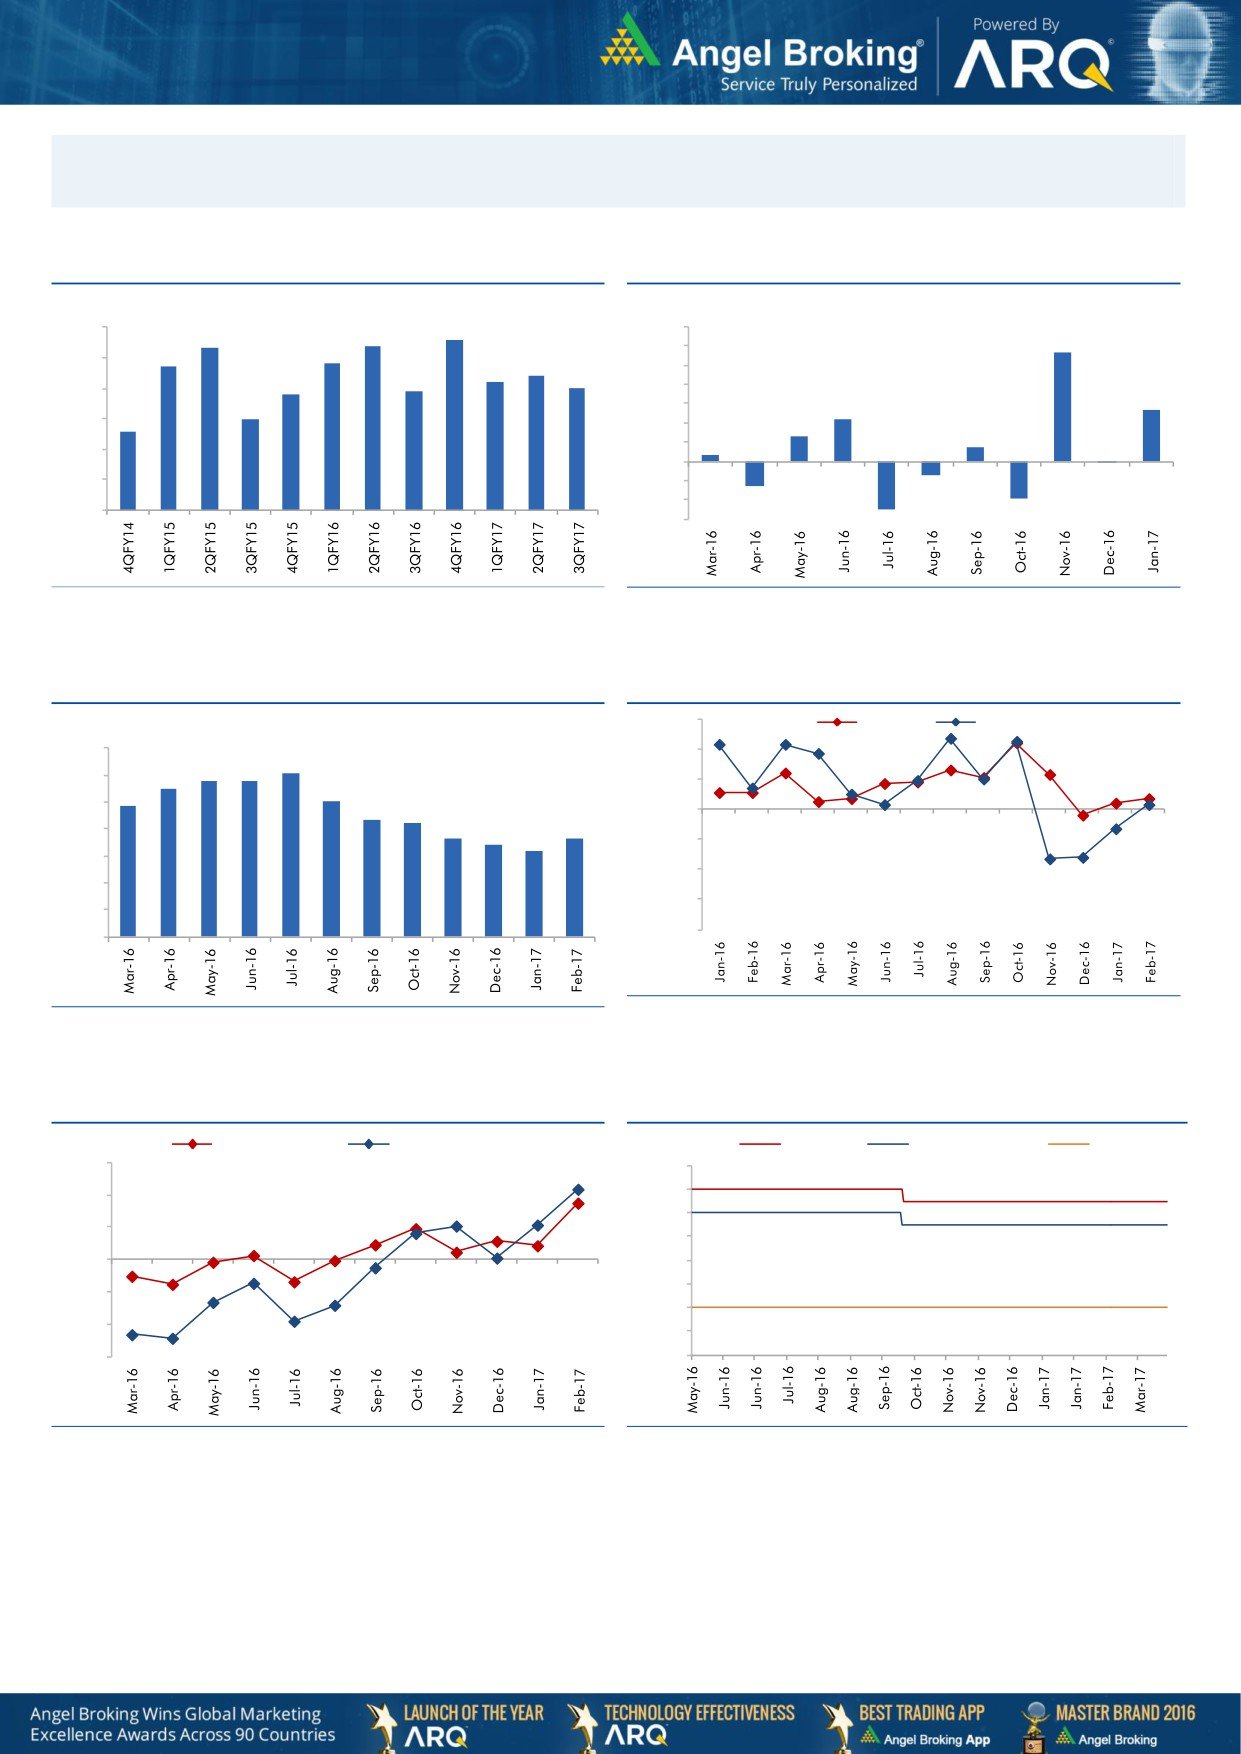
Macro watch
Exhibit 1: Quarterly GDP trends
Exhibit 2: IIP trends
(%)
(%)
8.6
9.0
8.4
7.0
8.3
5.7
7.7
7.8
6.0
8.0
7.4
7.2
5.0
6.9
7.0
6.8
7.0
4.0
2.7
6.0
3.0
2.2
6.0
5.6
1.3
2.0
0.7
1.0
0.3
5.0
-
4.0
(1.0)
(0.1)
(0.7)
(2.0)
3.0
(1.3)
(3.0)
(1.9)
(2.5)
Source: CSO, Angel Research
Source: MOSPI, Angel Research
Exhibit 3: Monthly CPI inflation trends
Exhibit 4: Manufacturing and services PMI
56.0
Mfg. PMI
Services PMI
(%)
7.0
54.0
6.1
5.8
5.8
6.0
5.5
5.1
52.0
4.8
5.0
4.3
4.2
50.0
3.6
3.7
4.0
3.4
3.2
48.0
3.0
46.0
2.0
44.0
1.0
42.0
-
Source: Market, Angel Research; Note: Level above 50 indicates expansion
Source: MOSPI, Angel Research
Exhibit 5: Exports and imports growth trends
Exhibit 6: Key policy rates
(%)
Exports yoy growth
Imports yoy growth
(%)
Repo rate
Reverse Repo rate
CRR
30.0
7.00
20.0
6.50
6.00
10.0
5.50
0.0
5.00
4.50
(10.0)
4.00
(20.0)
3.50
(30.0)
3.00
Source: Bloomberg, Angel Research
Source: RBI, Angel Research
Market Outlook
March 28, 2017
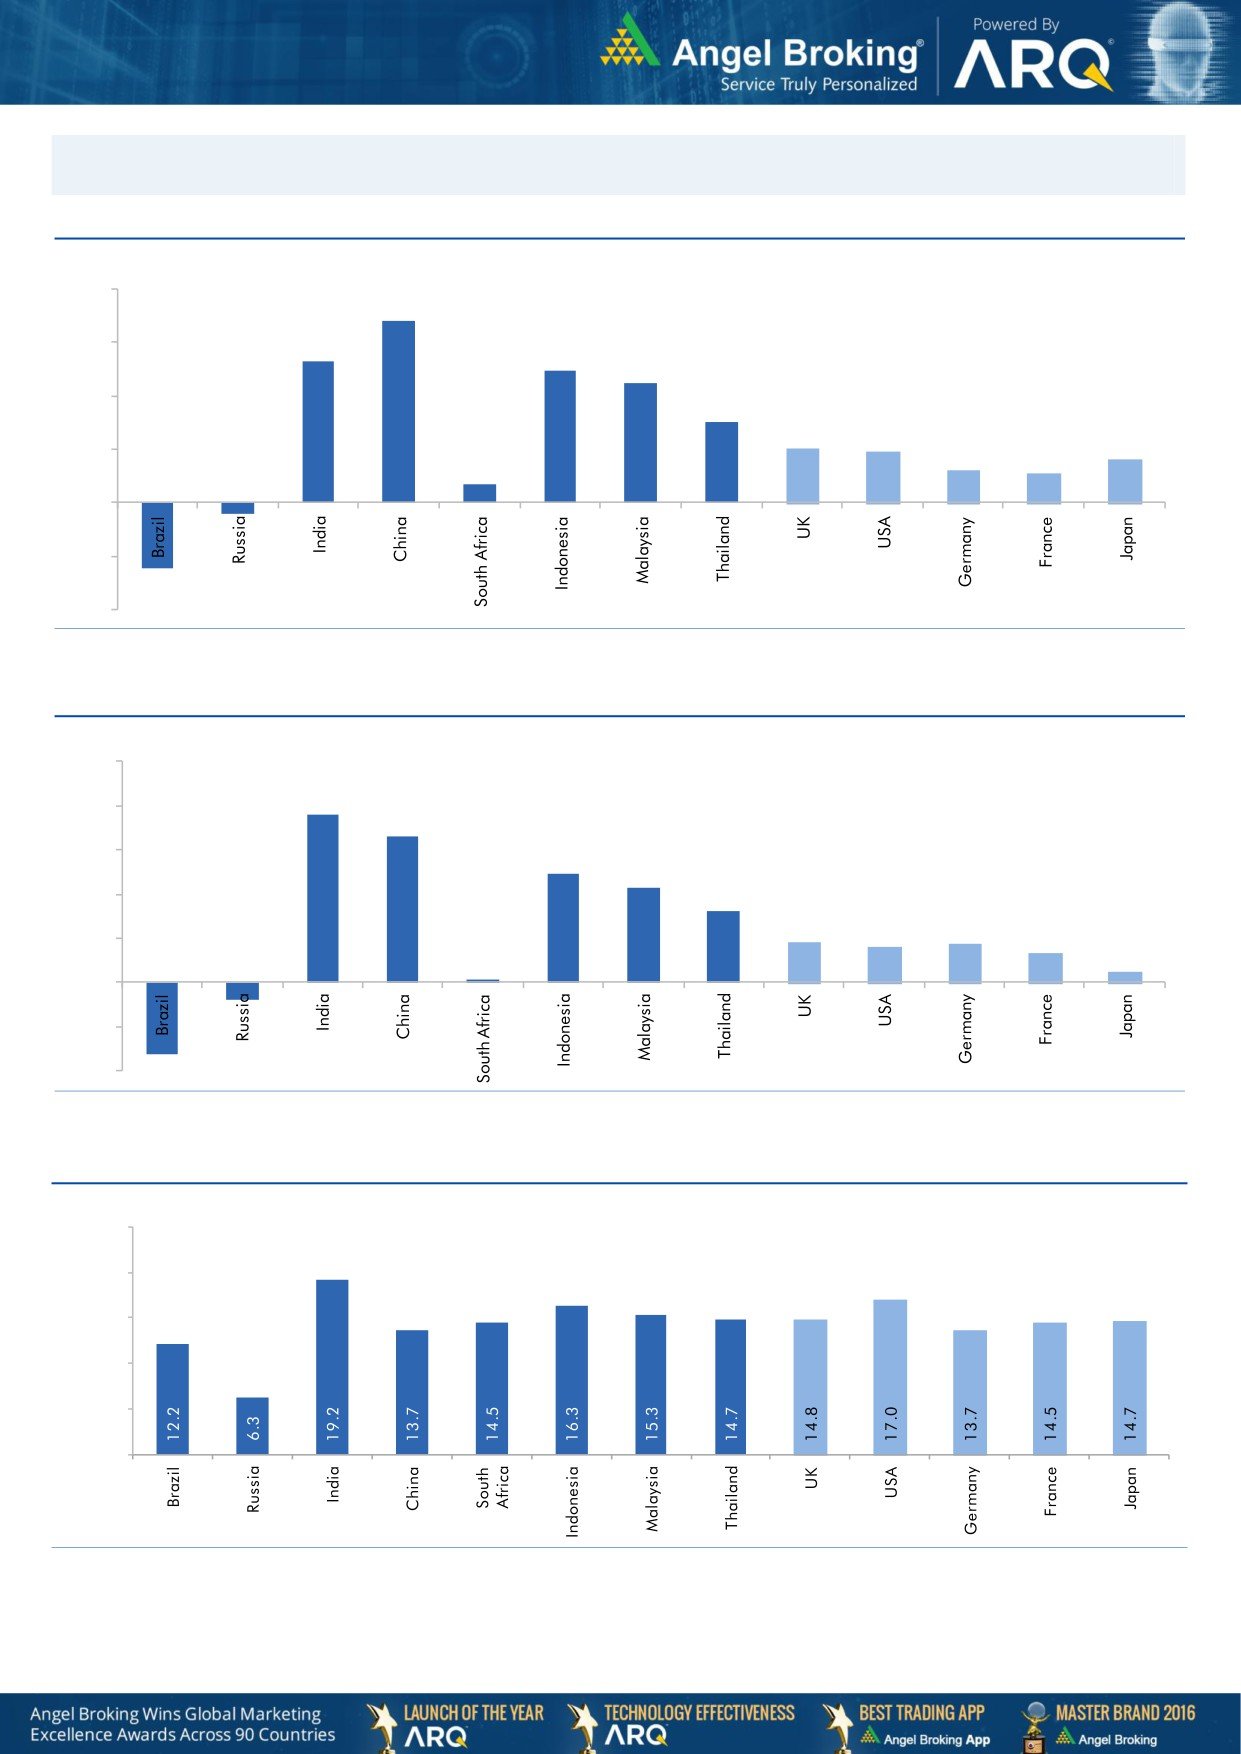
Global watch
Exhibit 1: Latest quarterly GDP Growth (%, yoy) across select developing and developed countries
(%)
8.0
6.8
6.0
5.3
4.9
0.7
4.5
4.0
3.0
2.0
1.9
2.0
1.2
1.6
1.1
-
(2.0)
(0.4)
(2.5)
(4.0)
Source: Bloomberg, Angel Research
Exhibit 2: 2016 GDP Growth projection by IMF (%, yoy) across select developing and developed countries
(%)
10.0
7.6
8.0
6.6
6.0
4.9
4.3
4.0
3.2
1.8
1.7
1.6
2.0
1.3
(0.8)
0.5
(3.3)
0.1
-
(2.0)
(4.0)
Source: IMF, Angel Research
Exhibit 3: One year forward P-E ratio across select developing and developed countries
(x)
25.0
20.0
15.0
10.0
5.0
-
Source: IMF, Angel Research
Market Outlook
March 28, 2017
Exhibit 4: Relative performance of indices across globe
Returns (%)
Country
Name of index
Closing price
1M
3M
1YR
Brazil
Bovespa
64,308
(6.9)
11.6
29.5
Russia
Micex
2,013
(5.4)
(7.4)
9.1
India
Nifty
9,045
1.5
13.4
18.9
China
Shanghai Composite
3,267
0.3
5.2
12.4
South Africa
Top 40
44,661
(0.9)
2.5
(4.2)
Mexico
Mexbol
49,313
4.5
9.2
7.5
Indonesia
LQ45
920
3.0
10.4
7.9
Malaysia
KLCI
1,745
2.4
6.8
1.5
Thailand
SET 50
995
1.3
6.1
12.0
USA
Dow Jones
20,551
(1.2)
3.1
16.5
UK
FTSE
7,294
0.3
3.3
18.1
Japan
Nikkei
18,986
(2.0)
(2.6)
11.8
Germany
DAX
11,996
0.4
4.6
25.4
France
CAC
5,017
2.6
3.5
18.2
Source: Bloomberg, Angel Research
Stock Watch
March 28, 2017
Company Name
Reco
CMP
Target
Mkt Cap
Sales ( Čcr )
OPM(%)
EPS (Č)
PER(x)
P/BV(x)
RoE(%)
EV/Sales(x)
(Č)
Price ( Č)
( Č cr )
FY17E
FY18E
FY17E
FY18E
FY17E
FY18E
FY17E
FY18E
FY17E
FY18E
FY17E
FY18E
FY17E
FY18E
Agri / Agri Chemical
Rallis
Neutral
241
-
4,681
1,937
2,164
13.3
14.3
9.0
11.0
26.7
21.9
4.7
4.1
18.4
19.8
2.5
2.2
United Phosphorus
Neutral
726
-
36,831
15,176
17,604
18.5
18.5
37.4
44.6
19.4
16.3
3.8
3.2
21.4
21.2
2.5
2.1
Auto & Auto Ancillary
Amara Raja Batteries
Buy
861
1,009
14,704
5,305
6,100
16.0
16.3
28.4
34.0
30.3
25.3
5.9
4.9
19.3
19.3
2.8
2.4
Apollo Tyres
Accumulate
211
235
10,720
12,877
14,504
14.3
13.9
21.4
23.0
9.8
9.2
1.5
1.3
16.4
15.2
1.0
0.9
Ashok Leyland
Buy
86
111
24,432
20,021
21,915
11.6
11.9
4.5
5.3
19.1
16.1
3.9
3.5
20.6
21.5
1.2
1.0
Bajaj Auto
Neutral
2,813
-
81,409
25,093
27,891
19.5
19.2
143.9
162.5
19.6
17.3
5.5
4.7
30.3
29.4
3.0
2.6
Bharat Forge
Neutral
1,017
-
23,683
7,726
8,713
20.5
21.2
35.3
42.7
28.8
23.8
5.3
4.8
18.9
20.1
3.1
2.7
Ceat
Accumulate
1,332
1,450
5,387
7,524
8,624
13.0
12.7
131.1
144.3
10.2
9.2
1.9
1.6
19.8
18.6
0.8
0.7
Eicher Motors
Neutral
24,164
-
65,750
16,583
20,447
17.5
18.0
598.0
745.2
40.4
32.4
13.8
10.5
41.2
38.3
3.8
3.0
Exide Industries
Neutral
214
-
18,152
7,439
8,307
15.0
15.0
8.1
9.3
26.4
23.0
3.7
3.3
14.3
16.7
2.1
1.8
Gabriel India
Neutral
124
-
1,781
1,544
1,715
9.0
9.3
5.4
6.3
23.0
19.7
4.3
3.8
18.9
19.5
1.1
1.0
Hero Motocorp
Neutral
3,340
-
66,704
28,083
30,096
15.3
15.7
171.8
187.0
19.4
17.9
6.8
5.7
30.1
27.9
2.2
2.0
Indag Rubber
Neutral
198
-
519
286
326
19.8
16.8
11.7
13.3
16.9
14.8
2.9
2.7
17.8
17.1
1.5
1.3
Jamna Auto Industries
Neutral
205
-
1,637
1,486
1,620
9.8
9.9
15.0
17.2
13.7
11.9
3.0
2.5
21.8
21.3
1.2
1.1
JK Tyres
Neutral
135
-
3,067
7,455
8,056
15.0
15.0
21.8
24.5
6.2
5.5
1.3
1.1
22.8
21.3
0.5
0.5
L G Balakrishnan & Bros Neutral
608
-
954
1,302
1,432
11.6
11.9
43.7
53.0
13.9
11.5
2.0
1.8
13.8
14.2
0.8
0.7
Mahindra and Mahindra Neutral
1,267
-
78,708
46,534
53,077
11.6
11.7
67.3
78.1
18.8
16.2
3.1
2.7
15.4
15.8
1.7
1.4
Maruti
Accumulate
5,986
6,560
180,834
67,822
83,288
16.0
16.4
253.8
312.4
23.6
19.2
5.4
4.4
23.0
22.9
2.3
1.8
Minda Industries
Neutral
433
-
3,433
2,728
3,042
9.0
9.1
68.2
86.2
6.4
5.0
1.4
1.1
23.8
24.3
1.3
1.1
Motherson Sumi
Neutral
366
-
51,315
45,896
53,687
7.8
8.3
13.0
16.1
28.0
22.7
9.0
7.2
34.7
35.4
1.2
1.0
Rane Brake Lining
Neutral
930
-
736
511
562
11.3
11.5
28.1
30.9
33.1
30.1
5.1
4.6
15.3
15.0
1.6
1.5
Setco Automotive
Neutral
34
-
455
741
837
13.0
13.0
15.2
17.0
2.2
2.0
0.4
0.3
15.8
16.3
1.0
0.9
Subros
Neutral
196
-
1,175
1,488
1,681
11.7
11.9
6.4
7.2
30.6
27.3
3.2
2.9
10.8
11.4
1.0
0.9
Swaraj Engines
Neutral
1,470
-
1,826
660
810
15.2
16.4
54.5
72.8
27.0
20.2
8.4
7.6
31.5
39.2
2.6
2.1
Tata Motors
Neutral
466
-
134,406
300,209
338,549
8.9
8.4
42.7
54.3
10.9
8.6
1.8
1.5
15.6
17.2
0.6
0.5
TVS Motor
Neutral
429
-
20,376
13,390
15,948
6.9
7.1
12.8
16.5
33.6
25.9
8.4
6.6
26.3
27.2
1.6
1.3
Capital Goods
ACE
Neutral
52
-
514
709
814
4.1
4.6
1.4
2.1
37.1
24.7
1.5
1.4
4.4
6.0
0.9
0.8
BEML
Neutral
1,311
-
5,459
3,451
4,055
6.3
9.2
31.4
57.9
41.8
22.6
2.5
2.3
6.3
10.9
1.7
1.4
BGR Energy
Neutral
134
-
965
16,567
33,848
6.0
5.6
7.8
5.9
17.2
22.7
1.0
1.0
4.7
4.2
0.2
0.1
Stock Watch
March 28, 2017
Company Name
Reco
CMP
Target
Mkt Cap
Sales ( Čcr )
OPM(%)
EPS (Č)
PER(x)
P/BV(x)
RoE(%)
EV/Sales(x)
(Č)
Price ( Č)
( Č cr )
FY17E
FY18E
FY17E
FY18E
FY17E
FY18E
FY17E
FY18E
FY17E
FY18E
FY17E
FY18E
FY17E
FY18E
Capital Goods
Bharat Electronics
Neutral
159
-
35,470
8,137
9,169
16.8
17.2
58.7
62.5
2.7
2.5
0.4
0.4
44.6
46.3
3.3
3.0
BHEL
Neutral
168
-
41,156
28,797
34,742
-
2.8
2.3
6.9
73.1
24.4
1.2
1.2
1.3
4.8
1.1
0.8
Blue Star
Accumulate
619
660
5,919
4,283
5,077
5.9
7.3
14.9
22.1
41.6
28.0
8.1
6.8
20.4
26.4
1.4
1.2
CG Power and Industrial
Neutral
77
-
4,842
5,777
6,120
5.9
7.0
3.3
4.5
23.4
17.2
1.0
1.0
4.4
5.9
0.8
0.7
Solutions
Greaves Cotton
Neutral
159
-
3,885
1,755
1,881
16.8
16.9
7.8
8.5
20.4
18.7
4.1
3.8
20.6
20.9
1.9
1.7
Inox Wind
Neutral
170
-
3,764
5,605
6,267
15.7
16.4
24.8
30.0
6.8
5.7
1.9
1.4
25.9
24.4
0.7
0.6
KEC International
Neutral
193
-
4,970
9,294
10,186
7.9
8.1
9.9
11.9
19.5
16.2
2.9
2.5
15.6
16.3
0.8
0.7
KEI Industries
Buy
176
207
1,365
2,682
3,058
10.4
10.0
11.7
12.8
15.0
13.7
3.0
2.5
20.1
18.2
0.7
0.6
Thermax
Neutral
905
-
10,788
5,421
5,940
7.3
7.3
25.7
30.2
35.2
30.0
4.3
3.9
12.2
13.1
1.9
1.7
VATech Wabag
Neutral
673
-
3,671
3,136
3,845
8.9
9.1
26.0
35.9
25.9
18.7
3.2
2.8
13.4
15.9
1.1
0.9
Voltas
Neutral
388
-
12,847
6,511
7,514
7.9
8.7
12.9
16.3
30.1
23.8
5.4
4.8
16.7
18.5
1.7
1.5
Cement
ACC
Neutral
1,396
-
26,215
11,225
13,172
13.2
16.9
44.5
75.5
31.4
18.5
3.0
2.7
11.2
14.2
2.3
2.0
Ambuja Cements
Neutral
228
-
45,243
9,350
10,979
18.2
22.5
5.8
9.5
39.3
24.0
3.3
3.0
10.2
12.5
4.8
4.1
India Cements
Neutral
154
-
4,726
4,364
4,997
18.5
19.2
7.9
11.3
19.5
13.6
1.4
1.4
8.0
8.5
1.8
1.6
J K Lakshmi Cement
Neutral
435
-
5,119
2,913
3,412
14.5
19.5
7.5
22.5
58.0
19.3
3.6
3.0
12.5
18.0
2.3
2.0
JK Cement
Neutral
893
-
6,242
4,398
5,173
15.5
17.5
31.2
55.5
28.6
16.1
3.4
3.0
12.0
15.5
2.0
1.6
Orient Cement
Neutral
127
-
2,600
2,114
2,558
18.5
20.5
8.1
11.3
15.7
11.2
2.3
2.0
9.0
14.0
1.8
1.4
UltraTech Cement
Neutral
3,954
-
108,529
25,768
30,385
21.0
23.5
111.0
160.0
35.6
24.7
4.5
4.0
13.5
15.8
4.3
3.6
Construction
Engineers India
Neutral
147
-
9,889
1,725
1,935
16.0
19.1
11.4
13.9
12.9
10.6
1.8
1.7
13.4
15.3
4.7
4.2
Gujarat Pipavav Port
Neutral
169
-
8,170
705
788
52.2
51.7
5.0
5.6
33.8
30.2
3.3
3.0
11.2
11.2
11.2
9.6
ITNL
Neutral
105
-
3,467
8,946
10,017
31.0
31.6
8.1
9.1
13.0
11.6
0.5
0.5
4.2
5.0
3.7
3.5
KNR Constructions
Neutral
178
-
2,506
1,385
1,673
14.7
14.0
41.2
48.5
4.3
3.7
0.8
0.7
14.9
15.2
1.9
1.6
Larsen & Toubro
Accumulate
1,547
1,700
144,297
111,017
124,908
11.0
11.0
61.1
66.7
25.3
23.2
3.0
2.8
13.1
12.9
2.3
2.2
MEP Infra
Neutral
53
-
863
1,877
1,943
30.6
29.8
3.0
4.2
17.7
12.6
8.6
5.8
0.6
0.6
1.8
1.7
Nagarjuna Const.
Neutral
81
-
4,500
8,842
9,775
9.1
8.8
5.3
6.4
15.3
12.7
1.2
1.1
8.2
9.1
0.7
0.6
NBCC
Neutral
175
-
15,723
7,428
9,549
7.9
8.6
8.2
11.0
21.3
15.9
1.1
0.8
28.2
28.7
1.8
1.4
PNC Infratech
Buy
119
143
3,061
2,350
2,904
13.1
13.2
9.0
8.8
13.3
13.6
0.5
0.4
15.9
13.9
1.4
1.2
Power Mech Projects
Neutral
520
-
765
1,801
2,219
12.7
14.6
72.1
113.9
7.2
4.6
1.3
1.1
16.8
11.9
0.4
0.3
Sadbhav Engineering
Neutral
302
-
5,187
3,598
4,140
10.3
10.6
9.0
11.9
33.6
25.4
3.5
3.1
9.9
11.9
1.7
1.5
Stock Watch
March 28, 2017
Company Name
Reco
CMP
Target
Mkt Cap
Sales ( Čcr )
OPM(%)
EPS (Č)
PER(x)
P/BV(x)
RoE(%)
EV/Sales(x)
(Č)
Price ( Č)
( Č cr )
FY17E
FY18E
FY17E
FY18E
FY17E
FY18E
FY17E
FY18E
FY17E
FY18E
FY17E
FY18E
FY17E
FY18E
Construction
Simplex Infra
Neutral
310
-
1,531
6,829
7,954
10.5
10.5
31.4
37.4
9.9
8.3
1.0
0.9
9.9
13.4
0.7
0.5
SIPL
Neutral
102
-
3,591
1,036
1,252
65.5
66.2
(8.4)
(5.6)
3.8
4.4
(22.8)
(15.9)
11.7
9.7
Financials
Axis Bank
Buy
487
580
116,628
46,932
53,575
3.5
3.4
32.4
44.6
15.1
10.9
1.9
1.7
13.6
16.5
-
-
Bank of Baroda
Neutral
172
-
39,562
19,980
23,178
1.8
1.8
11.5
17.3
14.9
9.9
1.7
1.4
8.3
10.1
-
-
Can Fin Homes
Neutral
2,081
-
5,539
420
526
3.5
3.5
86.5
107.8
24.1
19.3
5.2
4.2
23.6
24.1
-
-
Canara Bank
Neutral
297
-
16,116
15,225
16,836
1.8
1.8
14.5
28.0
20.5
10.6
1.4
1.1
5.8
8.5
-
-
Cholamandalam Inv. &
Buy
1,007
1,230
15,734
2,012
2,317
6.3
6.3
42.7
53.6
23.6
18.8
3.7
3.2
16.9
18.3
-
-
Fin. Co.
Dewan Housing Finance Neutral
363
-
11,368
2,225
2,688
2.9
2.9
29.7
34.6
12.2
10.5
2.0
1.7
16.1
16.8
-
-
Equitas Holdings
Buy
159
235
5,370
939
1,281
11.7
11.5
5.8
8.2
27.4
19.4
2.4
2.1
10.9
11.5
-
-
Federal Bank
Neutral
90
-
15,523
8,259
8,995
3.0
3.0
4.3
5.6
21.0
16.1
1.8
1.6
8.5
10.1
-
-
HDFC
Neutral
1,475
-
234,242
11,475
13,450
3.4
3.4
45.3
52.5
32.6
28.1
6.3
5.5
20.2
20.5
-
-
HDFC Bank
Neutral
1,411
-
361,342
46,097
55,433
4.5
4.5
58.4
68.0
24.2
20.8
4.2
3.5
18.8
18.6
-
-
ICICI Bank
Buy
274
315
159,269
42,800
44,686
3.1
3.3
18.0
21.9
15.2
12.5
2.1
1.9
11.1
12.3
-
-
Lakshmi Vilas Bank
Neutral
166
-
3,179
3,339
3,799
2.7
2.8
11.0
14.0
15.1
11.9
1.6
1.4
11.2
12.7
-
-
LIC Housing Finance
Neutral
608
-
30,696
3,712
4,293
2.6
2.5
39.0
46.0
15.6
13.2
2.9
2.5
19.9
20.1
-
-
Punjab Natl.Bank
Neutral
147
-
31,228
23,532
23,595
2.3
2.4
6.8
12.6
21.6
11.7
3.3
2.4
3.3
6.5
-
-
RBL Bank
Neutral
496
-
18,333
1,783
2,309
2.6
2.6
12.7
16.4
39.0
30.2
4.3
3.8
12.8
13.3
-
-
Repco Home Finance
Buy
665
825
4,160
388
457
4.5
4.2
30.0
38.0
22.2
17.5
3.7
3.1
18.0
19.2
-
-
South Ind.Bank
Neutral
20
-
2,731
6,435
7,578
2.5
2.5
2.7
3.1
7.5
6.5
1.0
0.8
10.1
11.2
-
-
St Bk of India
Neutral
279
-
222,740
88,650
98,335
2.6
2.6
13.5
18.8
20.7
14.9
2.0
1.7
7.0
8.5
-
-
Union Bank
Neutral
155
-
10,659
13,450
14,925
2.3
2.3
25.5
34.5
6.1
4.5
0.9
0.8
7.5
10.2
-
-
Yes Bank
Neutral
1,528
-
64,726
8,978
11,281
3.3
3.4
74.0
90.0
20.7
17.0
3.9
3.3
17.0
17.2
-
-
FMCG
Akzo Nobel India
Neutral
1,799
-
8,626
2,955
3,309
13.3
13.7
57.2
69.3
31.5
26.0
10.3
8.6
32.7
33.3
2.7
2.4
Asian Paints
Neutral
1,044
-
100,131
17,128
18,978
16.8
16.4
19.1
20.7
54.7
50.4
19.0
17.9
34.8
35.5
5.8
5.2
Britannia
Accumulate
3,301
3,626
39,614
9,594
11,011
14.6
14.9
80.3
94.0
41.1
35.1
16.9
13.1
41.2
-
4.0
3.4
Colgate
Neutral
982
-
26,698
4,605
5,149
23.4
23.4
23.8
26.9
41.2
36.5
22.8
17.9
64.8
66.8
5.7
5.1
Dabur India
Accumulate
274
304
48,283
8,315
9,405
19.8
20.7
8.1
9.2
33.8
29.8
9.4
7.8
31.6
31.0
5.5
4.8
GlaxoSmith Con*
Neutral
5,201
-
21,875
4,350
4,823
21.2
21.4
179.2
196.5
29.0
26.5
7.7
6.5
27.1
26.8
4.4
3.9
Godrej Consumer
Neutral
1,672
-
56,948
10,235
11,428
18.4
18.6
41.1
44.2
40.7
37.8
9.0
7.6
24.9
24.8
5.6
5.0
Stock Watch
March 28, 2017
Company Name
Reco
CMP
Target
Mkt Cap
Sales ( Čcr )
OPM(%)
EPS (Č)
PER(x)
P/BV(x)
RoE(%)
EV/Sales(x)
(Č)
Price ( Č)
( Č cr )
FY17E FY18E
FY17E
FY18E
FY17E
FY18E
FY17E
FY18E
FY17E
FY18E
FY17E
FY18E
FY17E
FY18E
FMCG
HUL
Neutral
898
-
194,246
35,252
38,495
17.8
17.8
20.7
22.4
43.5
40.1
41.5
35.6
95.6
88.9
5.4
4.9
ITC
Neutral
282
-
342,227
40,059
44,439
38.3
39.2
9.0
10.1
31.4
27.8
8.8
7.7
27.8
27.5
8.0
7.2
Marico
Neutral
287
-
37,040
6,430
7,349
18.8
19.5
6.4
7.7
44.9
37.3
13.5
11.4
33.2
32.5
5.6
4.8
Nestle*
Neutral
6,438
-
62,071
10,073
11,807
20.7
21.5
124.8
154.2
51.6
41.8
21.2
19.1
34.8
36.7
6.0
5.1
Procter & Gamble
Accumulate
6,892
7,369
22,370
2,939
3,342
23.2
23.0
146.2
163.7
47.1
42.1
11.9
9.9
25.3
23.5
7.2
6.2
Hygiene
Tata Global
Neutral
149
-
9,379
8,675
9,088
9.8
9.8
7.4
8.2
20.1
18.1
1.6
1.5
7.9
8.1
1.0
0.9
IT
HCL Tech^
Buy
856
1,000
120,758
49,242
57,168
20.5
20.5
55.7
64.1
15.4
13.4
3.1
2.4
20.3
17.9
2.3
1.9
Infosys
Buy
1,029
1,249
236,310
68,350
77,326
27.0
27.0
62.5
69.4
16.5
14.8
3.5
3.2
21.3
21.6
2.9
2.5
TCS
Accumulate
2,412
2,700
475,287
119,025
133,308
27.6
27.6
131.2
145.5
18.4
16.6
6.0
5.5
32.4
33.1
3.8
3.3
Tech Mahindra
Buy
468
600
45,599
29,673
32,937
15.5
17.0
32.8
39.9
14.3
11.7
2.8
2.4
19.6
20.7
1.3
1.1
Wipro
Buy
503
583
122,383
55,440
60,430
18.1
18.1
36.1
38.9
14.0
12.9
2.5
2.3
19.0
17.6
1.9
1.7
Media
D B Corp
Neutral
381
-
6,997
2,297
2,590
27.4
28.2
21.0
23.4
18.1
16.3
4.2
3.7
23.7
23.1
2.8
2.5
Hindustan Media
Neutral
285
-
2,093
1,016
1,138
24.3
25.2
27.3
30.1
10.5
9.5
2.0
1.8
16.2
15.8
1.4
1.2
Ventures
HT Media
Neutral
81
-
1,888
2,693
2,991
12.6
12.9
7.9
9.0
10.3
9.0
0.9
0.8
7.8
8.3
0.3
0.2
Jagran Prakashan
Buy
177
225
5,788
2,355
2,635
28.0
28.0
10.8
12.5
16.4
14.2
3.6
3.1
21.7
21.7
2.5
2.2
Sun TV Network
Neutral
761
-
29,972
2,850
3,265
70.1
71.0
26.2
30.4
29.0
25.0
7.4
6.6
24.3
25.6
10.1
8.7
TV Today Network
Buy
266
344
1,586
567
645
26.7
27.0
15.4
18.1
17.3
14.7
2.6
2.2
14.9
15.2
2.4
2.0
Metals & Mining
Coal India
Neutral
292
-
181,194
84,638
94,297
21.4
22.3
24.5
27.1
11.9
10.8
5.0
4.7
42.6
46.0
1.7
1.5
Hind. Zinc
Neutral
324
-
136,900
14,252
18,465
55.9
48.3
15.8
21.5
20.5
15.1
3.3
2.9
17.0
20.7
9.6
7.4
Hindalco
Neutral
189
-
38,951
107,899
112,095
7.4
8.2
9.2
13.0
20.5
14.5
1.0
0.9
4.8
6.6
0.9
0.8
JSW Steel
Neutral
180
-
43,389
53,201
58,779
16.1
16.2
130.6
153.7
1.4
1.2
0.2
0.2
14.0
14.4
1.6
1.4
NMDC
Neutral
134
-
42,396
6,643
7,284
44.4
47.7
7.1
7.7
18.9
17.4
1.6
1.6
8.8
9.2
4.2
3.7
SAIL
Neutral
60
-
24,904
47,528
53,738
(0.7)
2.1
(1.9)
2.6
23.2
0.7
0.6
(1.6)
3.9
1.4
1.2
Tata Steel
Neutral
478
-
46,390
121,374
121,856
7.2
8.4
18.6
34.3
25.7
13.9
1.6
1.5
6.1
10.1
1.0
1.0
Vedanta
Neutral
261
-
77,438
71,744
81,944
19.2
21.7
13.4
20.1
19.5
13.0
1.7
1.5
8.4
11.3
1.5
1.1
Oil & Gas
Cairn India
Neutral
292
-
54,682
9,127
10,632
4.3
20.6
8.8
11.7
33.1
24.9
1.1
1.0
3.3
4.2
7.5
6.2
GAIL
Neutral
375
-
63,466
56,220
65,198
9.3
10.1
27.1
33.3
13.9
11.3
1.3
1.2
9.3
10.7
1.3
1.1
Indian Oil Corp
Neutral
371
-
180,106
373,359
428,656
5.9
5.5
54.0
59.3
6.9
6.3
1.1
1.0
16.0
15.6
0.6
0.5
ONGC
Neutral
189
-
242,805
137,222
152,563
15.0
21.8
19.5
24.1
9.7
7.9
0.8
0.8
8.5
10.1
2.1
1.8
Stock Watch
March 28, 2017
Company Name
Reco
CMP
Target
Mkt Cap
Sales ( Čcr )
OPM(%)
EPS (Č)
PER(x)
P/BV(x)
RoE(%)
EV/Sales(x)
(Č)
Price ( Č)
( Č cr )
FY17E FY18E
FY17E
FY18E
FY17E
FY18E
FY17E
FY18E
FY17E
FY18E
FY17E
FY18E
FY17E
FY18E
Oil & Gas
Reliance Industries
Neutral
1,251
-
405,741
301,963
358,039
12.1
12.6
87.7
101.7
14.3
12.3
1.5
1.3
10.7
11.3
1.8
1.5
Pharmaceuticals
Alembic Pharma
Buy
586
689
11,048
3,483
4,244
20.2
21.4
24.3
33.6
24.1
17.5
5.5
4.4
25.5
25.3
3.1
2.5
Alkem Laboratories Ltd
Neutral
2,211
-
26,439
6,065
7,009
18.7
20.0
80.2
92.0
27.6
24.1
6.2
5.2
22.5
21.6
4.3
3.7
Aurobindo Pharma
Buy
670
877
39,271
15,720
18,078
23.7
23.7
41.4
47.3
16.2
14.2
4.2
3.3
29.6
26.1
2.7
2.4
Aventis*
Neutral
4,685
-
10,790
2,277
2,597
16.6
17.4
128.9
157.0
36.4
29.8
6.2
4.8
21.6
26.4
4.5
3.8
Cadila Healthcare
Neutral
449
-
45,956
10,429
12,318
17.7
21.6
13.1
19.2
34.3
23.4
7.2
5.7
22.8
27.1
4.4
3.7
Cipla
Sell
592
465
47,625
15,378
18,089
15.7
16.8
19.3
24.5
30.7
24.2
3.6
3.2
12.3
13.9
3.3
2.7
Dishman Pharma
Sell
232
143
3,742
1,718
1,890
22.7
22.8
9.5
11.3
24.4
20.5
2.4
2.1
10.1
10.9
2.6
2.3
Dr Reddy's
Neutral
2,639
-
43,716
16,043
18,119
18.0
23.0
78.6
130.9
33.6
20.2
3.3
2.9
10.1
15.2
2.5
2.4
GSK Pharma*
Neutral
2,738
-
23,187
2,800
3,290
10.2
20.6
32.2
60.3
85.0
45.4
15.7
15.6
17.2
34.5
8.1
6.9
Indoco Remedies
Reduce
259
240
2,383
1,112
1,289
16.2
18.2
11.6
16.0
22.3
16.2
3.6
3.0
17.0
20.1
2.3
1.9
Ipca labs
Accumulate
578
613
7,294
3,258
3,747
12.8
15.3
12.1
19.2
47.8
30.1
3.0
2.7
6.4
9.5
2.4
2.1
Lupin
Buy
1,463
1,809
66,063
15,912
18,644
26.4
26.7
58.1
69.3
25.2
21.1
4.9
4.0
21.4
20.9
4.2
3.5
Sun Pharma
Buy
691
847
165,775
31,129
35,258
32.0
32.9
30.2
35.3
22.9
19.6
3.7
3.1
20.0
20.1
4.9
4.1
Power
NTPC
Neutral
164
-
134,855
86,605
95,545
17.5
20.8
11.8
13.4
13.9
12.2
1.4
1.3
10.5
11.1
2.9
2.9
Power Grid
Accumulate
195
223
102,225
25,315
29,193
88.2
88.7
14.2
17.2
13.8
11.4
2.1
1.8
15.2
16.1
8.7
7.8
Tata Power
Neutral
87
-
23,613
36,916
39,557
17.4
27.1
5.1
6.3
17.1
13.9
1.5
1.4
9.0
10.3
1.7
1.5
Real Estate
MLIFE
Buy
413
522
1,695
1,152
1,300
22.7
24.6
29.9
35.8
13.8
11.5
1.0
1.0
7.6
8.6
2.2
1.8
Prestige Estate
Neutral
204
-
7,652
4,707
5,105
25.2
26.0
10.3
13.0
19.8
15.7
1.6
1.5
10.3
10.2
2.8
2.5
Telecom
Bharti Airtel
Neutral
339
-
135,352
105,086
114,808
34.5
34.7
12.2
16.4
27.8
20.7
1.9
1.8
6.8
8.4
2.2
1.9
Idea Cellular
Neutral
88
-
31,531
40,133
43,731
37.2
37.1
6.4
6.5
13.7
13.5
1.1
1.1
8.2
7.6
1.8
1.5
zOthers
Abbott India
Neutral
4,609
-
9,793
3,153
3,583
14.1
14.4
152.2
182.7
30.3
25.2
148.7
127.0
25.6
26.1
2.8
2.4
Asian Granito
Accumulate
352
380
1,059
1,060
1,169
12.2
12.5
12.7
15.9
27.8
22.2
2.6
2.4
9.5
10.7
1.3
1.1
Bajaj Electricals
Accumulate
313
330
3,165
4,801
5,351
5.7
6.2
10.4
13.7
30.0
22.9
3.7
3.3
12.4
14.5
0.7
0.6
Banco Products (India)
Neutral
212
-
1,517
1,353
1,471
12.3
12.4
14.5
16.3
14.6
13.0
20.2
18.2
14.5
14.6
1.1
113.9
Coffee Day Enterprises
Neutral
234
-
4,820
2,964
3,260
20.5
21.2
4.7
8.0
-
29.2
2.7
2.5
5.5
8.5
2.0
1.8
Ltd
Competent Automobiles Neutral
181
-
111
1,137
1,256
3.1
2.7
28.0
23.6
6.5
7.7
34.7
31.4
14.3
11.5
0.1
0.1
Elecon Engineering
Neutral
52
-
578
1,482
1,660
13.7
14.5
3.9
5.8
13.2
8.9
3.1
2.9
7.8
10.9
0.7
0.6
Finolex Cables
Neutral
490
-
7,499
2,883
3,115
12.0
12.1
14.2
18.6
34.5
26.4
18.4
16.1
15.8
14.6
2.3
2.1
Stock Watch
March 28, 2017
Company Name
Reco
CMP
Target
Mkt Cap
Sales ( Čcr )
OPM(%)
EPS (Č)
PER(x)
P/BV(x)
RoE(%)
EV/Sales(x)
(Č)
Price ( Č)
( Č cr )
FY17E
FY18E
FY17E
FY18E
FY17E
FY18E
FY17E
FY18E
FY17E
FY18E
FY17E
FY18E
FY17E
FY18E
zOthers
Garware Wall Ropes
Neutral
698
-
1,528
863
928
15.1
15.2
36.4
39.4
19.2
17.7
3.5
3.0
17.5
15.9
1.7
1.5
Goodyear India*
Neutral
797
-
1,837
1,598
1,704
10.4
10.2
49.4
52.6
16.1
15.1
74.4
65.3
18.2
17.0
0.8
117.7
Hitachi
Neutral
1,610
-
4,378
2,081
2,433
8.8
8.9
33.4
39.9
48.2
40.4
38.9
32.4
22.1
21.4
2.1
1.8
HSIL
Neutral
321
-
2,321
2,384
2,515
15.8
16.3
15.3
19.4
21.0
16.6
20.9
17.9
7.8
9.3
1.1
1.0
Interglobe Aviation
Neutral
1,053
-
38,050
21,122
26,005
14.5
27.6
110.7
132.1
9.5
8.0
56.9
40.6
168.5
201.1
1.8
1.4
Jyothy Laboratories
Neutral
348
-
6,317
1,440
2,052
11.5
13.0
8.5
10.0
40.9
34.8
9.9
9.2
18.6
19.3
4.7
3.3
Kirloskar Engines India
Neutral
388
-
5,611
2,554
2,800
9.9
10.0
10.5
12.1
37.0
32.1
15.5
14.6
10.7
11.7
1.8
1.6
Ltd
Linc Pen & Plastics
Neutral
309
-
456
382
420
9.3
9.5
13.5
15.7
22.9
19.7
3.9
3.4
17.1
17.3
1.3
1.1
M M Forgings
Neutral
536
-
647
546
608
20.4
20.7
41.3
48.7
13.0
11.0
73.5
65.0
16.6
17.0
1.0
0.9
Manpasand Bever.
Neutral
702
-
4,016
836
1,087
19.6
19.4
16.9
23.8
41.6
29.5
5.0
4.4
12.0
14.8
4.5
3.4
Mirza International
Buy
86
107
1,032
963
1,069
17.2
18.0
6.1
7.5
14.0
11.4
2.1
1.8
15.0
15.7
1.3
1.1
MT Educare
Neutral
78
-
311
366
417
17.7
18.2
9.4
10.8
8.3
7.2
1.9
1.6
22.2
22.3
0.8
0.6
Narayana Hrudaya
Neutral
309
-
6,318
1,873
2,166
11.5
11.7
2.6
4.0
116.9
78.0
7.2
6.5
6.1
8.3
3.5
3.0
Navkar Corporation
Buy
174
265
2,480
369
561
42.9
42.3
6.9
11.5
25.2
15.1
1.8
1.6
7.4
10.5
7.7
5.1
Navneet Education
Neutral
138
-
3,211
1,062
1,147
24.0
24.0
6.1
6.6
22.6
20.8
4.6
4.1
20.6
19.8
3.1
2.9
Nilkamal
Neutral
1,990
-
2,969
1,995
2,165
10.7
10.4
69.8
80.6
28.5
24.7
113.7
98.8
16.6
16.5
1.5
1.3
Page Industries
Neutral
14,702
-
16,398
2,450
3,124
20.1
17.6
299.0
310.0
49.2
47.4
327.4
250.0
47.1
87.5
6.7
5.3
Parag Milk Foods
Neutral
221
-
1,860
1,919
2,231
9.3
9.6
9.5
12.9
23.4
17.1
3.6
3.0
15.5
17.5
1.1
1.0
Quick Heal
Neutral
237
-
1,662
408
495
27.3
27.0
7.7
8.8
30.6
27.0
2.8
2.9
9.3
10.6
3.2
2.7
Radico Khaitan
Buy
124
147
1,644
1,667
1,824
13.0
13.2
6.7
8.2
18.6
15.1
1.7
1.5
9.0
10.2
1.4
1.2
Relaxo Footwears
Neutral
461
-
5,535
2,085
2,469
9.2
8.2
7.6
8.0
61.0
58.0
23.6
20.2
17.9
18.8
2.7
2.3
S H Kelkar & Co.
Neutral
302
-
4,365
1,036
1,160
15.1
15.0
6.1
7.2
49.4
42.1
5.3
4.8
10.7
11.5
4.1
3.6
Siyaram Silk Mills
Accumulate
1,705
1,872
1,598
1,652
1,857
11.6
11.7
92.4
110.1
18.4
15.5
2.7
2.4
14.7
15.2
1.2
1.0
Styrolution ABS India*
Neutral
642
-
1,129
1,440
1,537
9.2
9.0
40.6
42.6
15.8
15.1
40.4
36.7
12.3
11.6
0.7
0.7
Surya Roshni
Neutral
201
-
880
3,342
3,625
7.8
7.5
17.3
19.8
11.6
10.2
22.1
17.7
10.5
10.8
0.5
0.5
Team Lease Serv.
Neutral
937
-
1,602
3,229
4,001
1.5
1.8
22.8
32.8
41.2
28.5
4.4
3.8
10.7
13.4
0.4
0.3
The Byke Hospitality
Neutral
183
-
736
287
384
20.5
20.5
7.6
10.7
24.1
17.1
5.0
4.1
20.7
23.5
2.6
1.9
Transport Corporation of
Neutral
221
-
1,689
2,671
2,911
8.5
8.8
13.9
15.7
15.9
14.1
2.2
1.9
13.7
13.8
0.7
0.7
India
TVS Srichakra
Neutral
3,708
-
2,839
2,304
2,614
13.7
13.8
231.1
266.6
16.0
13.9
416.6
328.0
33.9
29.3
1.2
1.1
Stock Watch
March 28, 2017
Company Name
Reco
CMP
Target Mkt Cap
Sales ( Čcr )
OPM(%)
EPS (Č)
PER(x)
P/BV(x)
RoE(%)
EV/Sales(x)
(Č)
Price ( Č)
( Č cr )
FY17E FY18E FY17E FY18E FY17E FY18E FY17E FY18E FY17E FY18E FY17E FY18E FY17E FY18E
zOthers
UFO Moviez
Neutral
421
-
1,162
619
685
33.2
33.4
30.0
34.9
14.1
12.1
1.9
1.7
13.8
13.9
1.6
1.3
Visaka Industries
Neutral
269
-
428
1,051
1,138
10.3
10.4
21.0
23.1
12.8
11.6
34.5
32.3
9.0
9.2
0.7
0.6
VRL Logistics
Neutral
299
-
2,728
1,902
2,119
16.7
16.6
14.6
16.8
20.5
17.8
4.5
4.0
21.9
22.2
1.5
1.4
Wonderla Holidays
Neutral
380
-
2,147
287
355
38.0
40.0
11.3
14.2
33.6
26.8
4.8
4.2
21.4
23.9
7.2
5.8
VIP Industries
Neutral
180
-
2,541
1,270
1,450
10.4
10.4
5.6
6.5
32.1
27.7
6.7
5.8
20.7
21.1
2.0
1.7
Source: Company, Angel Research; Note: *December year end; #September year end; &October year end; Price as on March 27, 2017
Market Outlook
March 28, 2017
Research Team Tel: 022 - 39357800
DISCLAIMER
Angel Broking Private Limited (hereinafter referred to as “Angel”) is a registered Member of National Stock Exchange of India
Limited,Bombay Stock Exchange Limited and Metropolitan Stock Exchange Limited. It is also registered as a Depository Participant with
CDSL and Portfolio Manager with SEBI. It also has registration with AMFI as a Mutual Fund Distributor. Angel Broking Private Limited is a
registered entity with SEBI for Research Analyst in terms of SEBI (Research Analyst) Regulations, 2014 vide registration number
INH000000164. Angel or its associates has not been debarred/ suspended by SEBI or any other regulatory authority for accessing
/dealing in securities Market. Angel or its associates/analyst has not received any compensation / managed or
co-managed public offering of securities of the company covered by Analyst during the past twelve months.
This document is solely for the personal information of the recipient, and must not be singularly used as the basis of any investment
decision. Nothing in this document should be construed as investment or financial advice. Each recipient of this document should make
such investigations as they deem necessary to arrive at an independent evaluation of an investment in the securities of the companies
referred to in this document (including the merits and risks involved), and should consult their own advisors to determine the merits and
risks of such an investment.
Reports based on technical and derivative analysis center on studying charts of a stock's price movement, outstanding positions and
trading volume, as opposed to focusing on a company's fundamentals and, as such, may not match with a report on a company's
fundamentals. Investors are advised to refer the Fundamental and Technical Research Reports available on our website to evaluate the
contrary view, if any.
The information in this document has been printed on the basis of publicly available information, internal data and other reliable
sources believed to be true, but we do not represent that it is accurate or complete and it should not be relied on as such, as this
document is for general guidance only. Angel Broking Pvt. Limited or any of its affiliates/ group companies shall not be in any way
responsible for any loss or damage that may arise to any person from any inadvertent error in the information contained in this report.
Angel Broking Pvt. Limited has not independently verified all the information contained within this document. Accordingly, we cannot
testify, nor make any representation or warranty, express or implied, to the accuracy, contents or data contained within this document.
While Angel Broking Pvt. Limited endeavors to update on a reasonable basis the information discussed in this material, there may be
regulatory, compliance, or other reasons that prevent us from doing so.
This document is being supplied to you solely for your information, and its contents, information or data may not be reproduced,
redistributed or passed on, directly or indirectly.
Neither Angel Broking Pvt. Limited, nor its directors, employees or affiliates shall be liable for any loss or damage that may arise from
or in connection with the use of this information.